Debugging in Google Colab notebook
Why use a debugger
Jupyter notebooks in general have been really great for literate programming and exploratory learning. Google Colab allows you to directly create a Notebook and run algorithms on GPU (if you are doing Machine Learning) instead of having to deal with Jupyter or driver installations etc.
While I start to use Notebooks, one thing I've missed from the regular dev environment in an IDE is a debugger. Yes, you can always use print() as a quick substitute for debugger but sometimes you need to explore the problem more in the state it occurred, learn how the program is being executed etc. In those cases debuggers are super handy.
Gladly there is a way to debug code within Notebook albeit not as convenient as IDE but still good enough. Python already has pdb which is a command line based debugger but for Jupyter there is ipdb which is similar to pdb but for Jupyter notebooks. This debugger doesn't have any visual aspect to it as IDE do, but they allow you to perform similar capabilites such as "Continue", "Step into functions", evaluate expressions, jump to line etc.
Lets get into how to use ipdb in Google Colab.
ipdb in Google Colab
As ipdb is not packaged with Python itself so you need to install the package and import it.
!pip install -Uqq ipdb
import ipdb
Debug when hitting Exception
You can use the follow magic command in your Notebook to turn on debugging, so that whenever your code hits into an Exception, the code will pause and the debugger view will be opened for you to explore what caused the exception
%pdb on
In this example, we raised an exception and as you see that the debugger automatically starts when you hit an exception and I was able to inspect the value of i in that state. This is helpful when you don't know why an exception is occuring so you can pause at that point, inspect values and see what went wrong.
If you want to turn off this then just use %pdb off.
Setting breakpoints
If you have a complicated piece of code which isn't working as expected for certain inputs, you can add breakpoints in the code so when you execute the code, it will pause at that breakpoint. You can inspect what's going on or even run the code step by step to see what each line of code is doing.
Adding a breakpoint is as simple as adding ipdb.set_trace(). It will cause the code to pause when it reaches this line and open the debugger view. This function also takes in parameter such as ipdb.set_trace(context=6), here context refers to how many lines of code should it print when it pauses so you can get the code context surrounding the line it paused at.
Here you can see the code pauses execution when it reaches the line and I can inspect the variables such as arr. In the next section we will see what you can do when you are in debugger view.
Commands for ipdb
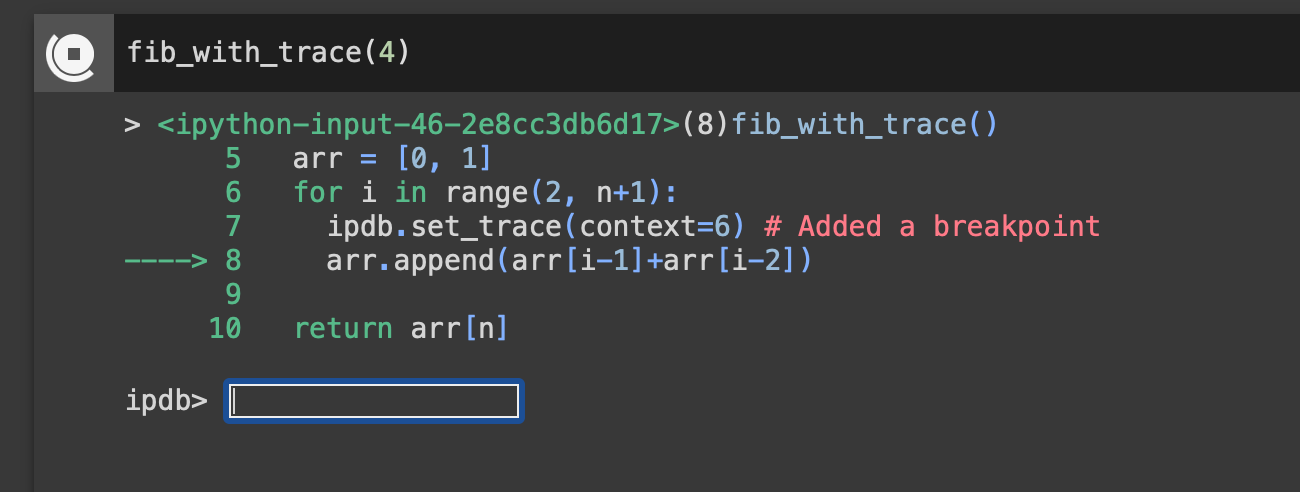
When the debugger is started you will see a view like above. It show the code and has an arrow ----> pointed at the line where its paused at. The input field below is where you can run various commands or use it as a regular REPL to execute python code such as inspecting variable values, evaluating an expresion, setting variables etc.
The input field also allows you to enter the commands for the debugger that allows you to control the flow of execution such as stepping into a function, jumping to a certain line of code, continue till you hit another breakpoint etc. Following is the basic set of commands that I found useful. You can find a more exhaustive list on Python Docs for pdb.
| Command | Description |
|---|---|
| h(elp) | Show various commands supported by ipdb |
| h(elp) COMMAND | Show description of the COMMAND specificed |
| c(ontinue) | Continue executing till it hits another breakpoint |
| n(ext) | Execute till next line in the same code frame. So if there is a function it wouldn't step into that function but execute it. |
| s(tep) | Step to next code, so if its a function, it will step into the function. |
| r(eturn) | Execute code till it returns from the current function or hits another breakpoint. |
| l(ist) | Show more of the source code surrounding the line. |
| w(here) | Shows the stacktrace i.e. the chain of functions that made it reach the current function |
| a(rguments) | List of arguments passed and its values to the function |
| q(uit) | Immediately stop execution and quit the debugger |
